Practice Grading Diastolic Dysfunction
4 Case Examples
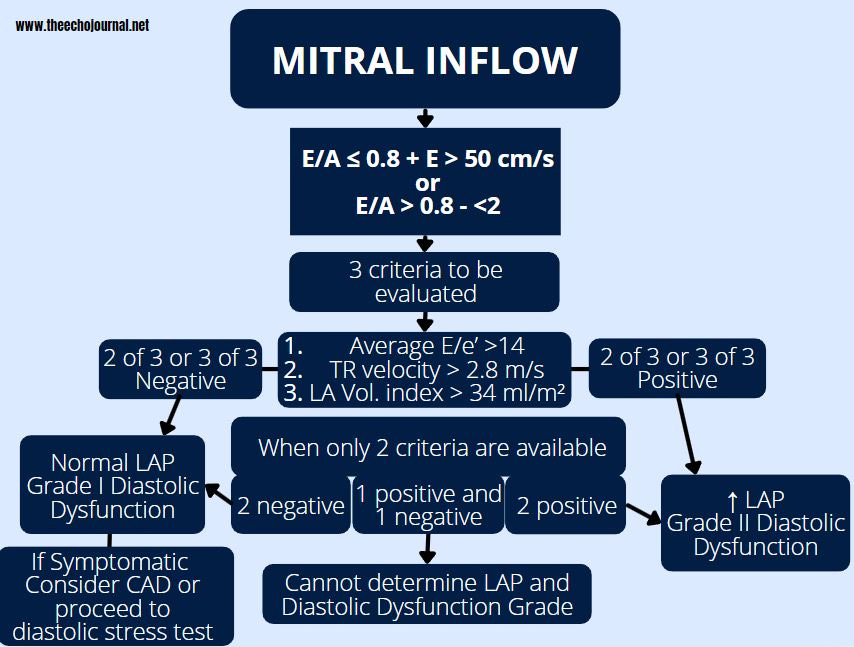
Over the past few weeks, we’ve been exploring the fundamentals of diastolic dysfunction. Now it’s time to put that knowledge to the test! Below, we will walk through 4 case examples grading diastolic function. If you haven’t already, we recommend reading our 1st article in the series, linked below, that includes helpful flow charts.
Start by evaluating each case independently, then check your answers with our detailed walkthrough, which follow ASE guidelines. Remember, the first question to consider—“Is the ejection fraction normal?”—is the first step in this process.
Reminder of the Key Parameters
Average E/e'
Septal e' velocity and Lateral e' velocity
Tricuspid regurgitation (TR) velocity
Left atrial (LA) volume index
E/A ratio
Peak E velocity
Case Example 1
Step 1: Is the LVEF normal or reduced?
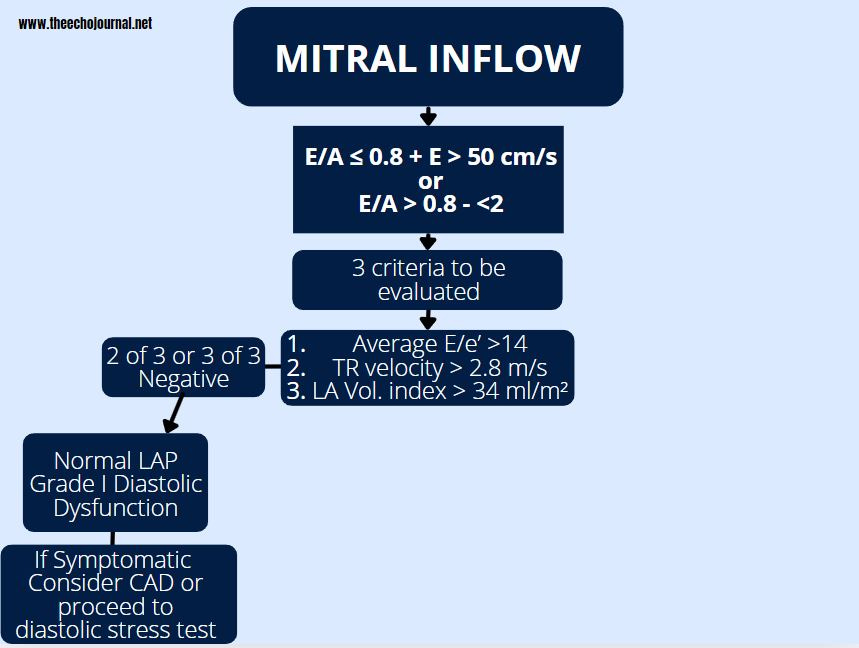
In this case LVEF is 49% which is mildly abnormal so we skip to the Mitral Inflow Chart.
Step 2: What is the E/A ratio and Peak E velocity?
E/A = 0.6
Peak E = 69 cm/s
The E/A is less than 0.8 and the Peak E is greater than 50 cm/s.
Step 3: What are the average E/e’, TR velocity, and LA volume index? How many of the 3 parameters above are positive (or true?).
E/e’ = 14.7
TR velocity is less than 2.8 m/s
LA Vol. Index = 20 ml/m2
If you answered Grade 1 (impaired relaxation) diastolic function, you are off to a great start! Now lets continue with a few other case examples to further your understanding of grading diastolic function.


