

When Waves Collide: A Guide to Sorting Out Doppler Drama
Understanding the Doppler Signals of Aortic Stenosis, Mitral Regurgitation, LVOT Obstruction, and Mid-Cavitary Gradients

How do we tell the difference between the following waveforms?
Aortic stenosis
Left ventricular outflow tract obstruction
Mid-cavitary gradients in hypertrophic obstructive cardiomyopathy
Mitral regurgitation
When multiple pathologies coexist, their Doppler profiles can overlap, making it difficult to parse out each individual signal. For new sonographers, one strategy is to evaluate each valve and region systematically, focusing on the timing of flow patterns within the cardiac cycle. The above pathologies have distinct Doppler shapes and velocities that are important to understand.
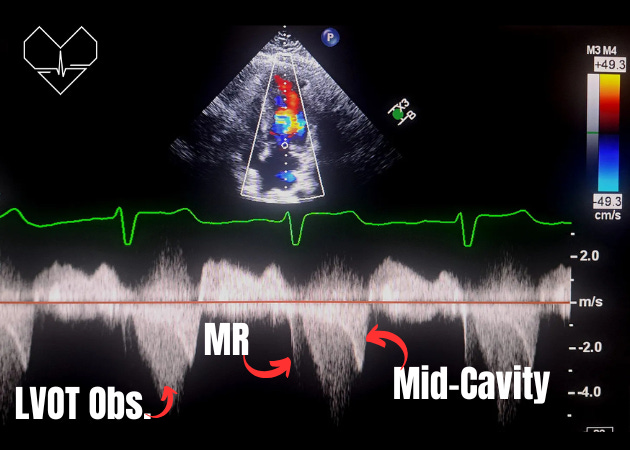
In the example below, you can observe the Doppler signals for MR, LVOT obstruction, and a mid-cavitary gradient. Pay close attention to the unique shape of each signal and the precise timing of their onset in relation to the QRS complex.
Aortic Stenosis (AS)
Overview: Aortic stenosis is the narrowing of the aortic valve, causing an obstructive jet in systole as blood exits the left ventricle.
Characteristic Doppler Signal in AS:
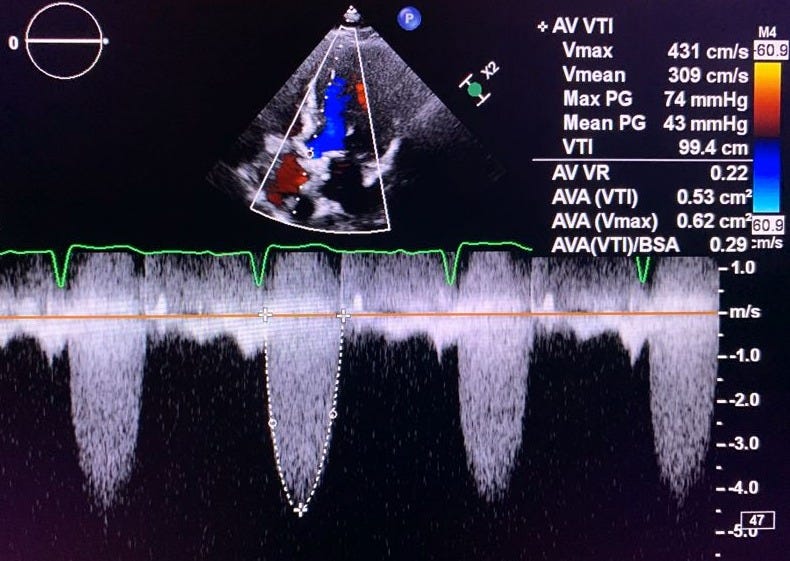
Flow Profile: Spectral Doppler shows a systolic jet with a crescendo-decrescendo (diamond-shaped) pattern.
Velocity: Peak systolic velocity is increased, often exceeding 4.0 m/s in severe AS.
Gradients: A calculated mean gradient through the aortic valve of >40 mmHg reflects severe stenosis.
Keep in mind that the velocity and gradients, even in severe AS cases, can vary (i.e. low-flow low-gradient).
Key Doppler Features on TTE:
View: Optimal in the apical 5-chamber or 3-chamber view.
Spectral Doppler: Continuous wave Doppler (CW Doppler) is essential to capture the peak and mean velocities of the AS jet.
TEE Considerations (when TTE is suboptimal):
The deep transgastric view in TEE offers an aligned perspective for measuring peak aortic velocities, especially in patients where apical TTE views are challenging.
ECG
Starts after the QRS complex
Left Ventricular Outflow Tract (LVOT) Obstruction
Overview: LVOT obstruction is often due to hypertrophic cardiomyopathy with septal hypertrophy.
Characteristic Doppler Signal in LVOT Obstruction:
Flow Profile: Late-peaking systolic jet that has a distinctive dagger-shaped pattern (gradual increase in velocity peaking later in systole).
Gradients: Varies based on obstruction severity, often peak gradient >30 mmHg in significant obstructions.
Dynamic Nature: The degree of obstruction can increase with maneuvers like Valsalva or during exertion.
Key Doppler Features on TTE:
View: Apical 5-chamber or 3-chamber views.
Spectral Doppler: CW Doppler captures the high-velocity, late-peaking signal. Pulsed-wave Doppler (PW Doppler) will often alias, making it impossible to measure.
TEE Considerations:
TEE can help visualize and assess LVOT obstruction severity if apical views are insufficient, but it’s typically secondary to TTE for initial evaluation.
ECG
Starts after the QRS complex
